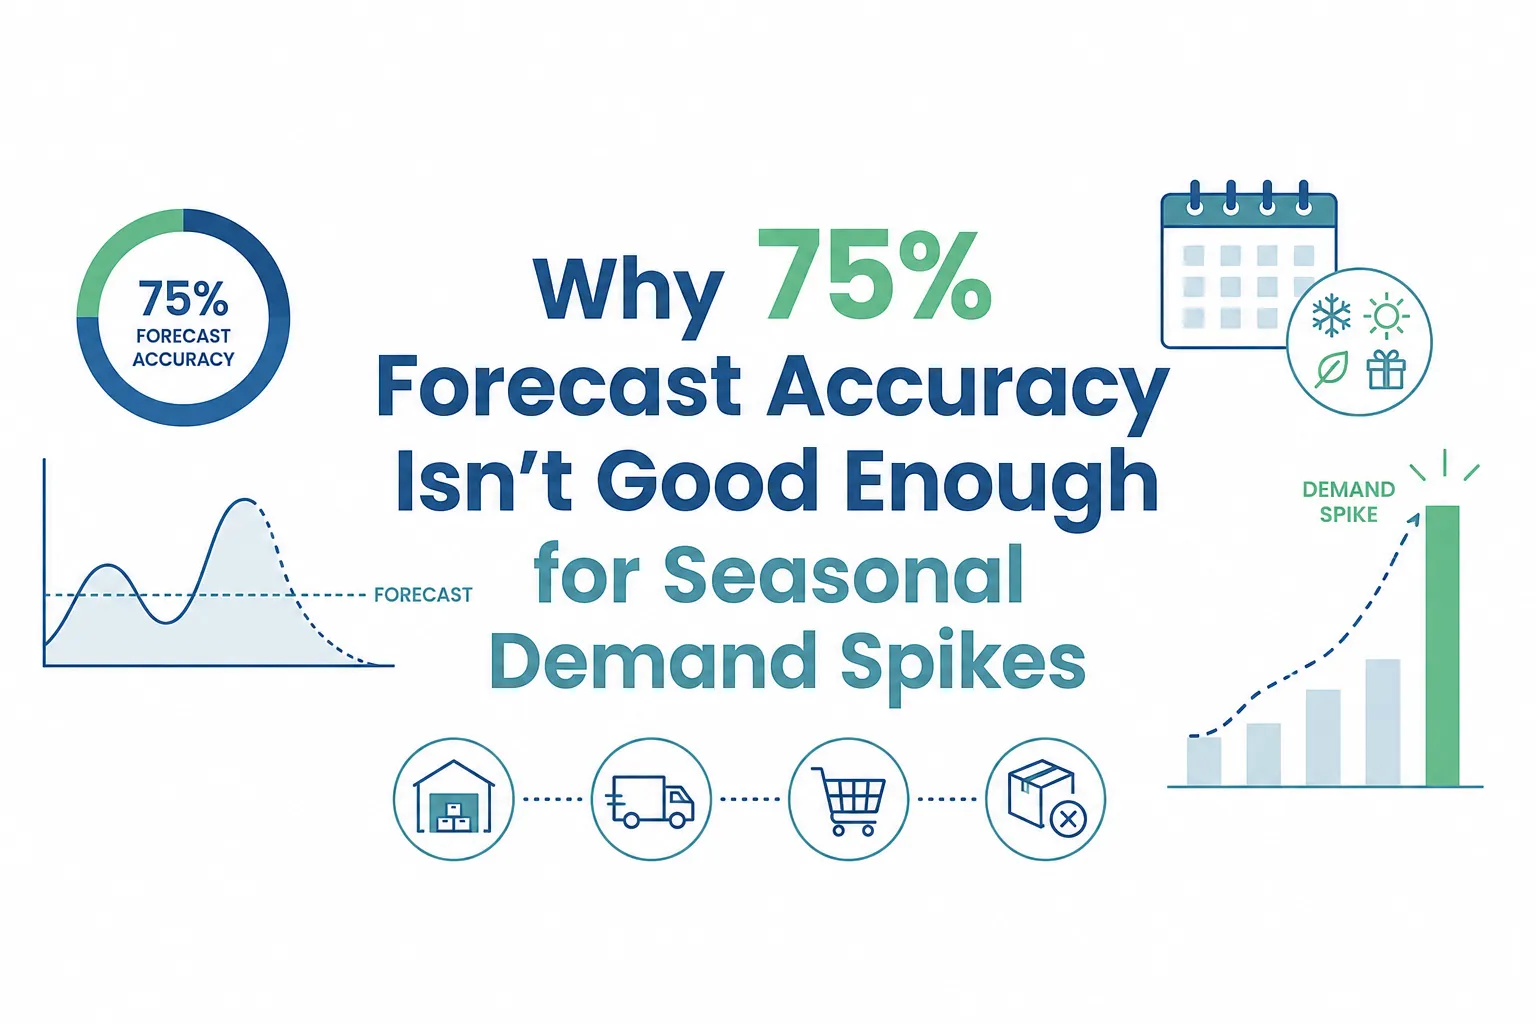
Somewhere in most S&OP decks, there's a number everyone has quietly agreed to be happy with. For a lot of planning teams, that number sits between 75% and 80% forecast accuracy comfortably above whatever their team considers acceptable, and good enough to stop asking hard questions about the model.
Then the season turns. A festive quarter, a back-to-school surge, a monsoon-driven demand shift and the same model that looked perfectly fine in a flat month misses by a mile. Suddenly, 75% doesn't feel like a good number. It feels like the size of the problem.
This is the gap that seasonal demand spikes expose every single cycle: the difference between a forecast that's statistically acceptable on average, and one that's actually good enough when it matters most.
The 75% Ceiling: Why “Good” Forecast Accuracy Isn't the Same as “Good Enough”
Across supply chain and demand planning teams, clearing 75-80% forecast accuracy is often treated as a milestone the point at which a forecast is considered reliable enough to stop scrutinizing. Once a team gets there, the instinct is to move on: tune the model once, review it quarterly, and trust it to hold.
The problem is that a single accuracy percentage, averaged across a full year, hides exactly the information you need most. Forecast error is rarely distributed evenly across the calendar. It concentrates at the edges the weeks before a seasonal peak, the months where demand swings hardest and the cost of being wrong is highest. A model can look reasonably accurate overall while missing badly during the exact weeks that decide whether inventory, capacity and cash are positioned correctly for the year.
Forecasting at SKU-and-location granularity, with continuous learning built in, closes most of that gap in practice. It isn't a marginal improvement it's the difference between reacting to a season after it has already surprised you, and planning for it with real confidence.
Why Seasonal Spikes Break Even “Good” Forecasting Models
One Model Rarely Fits Every Season or Region
Demand doesn't move uniformly. A single blended forecast, built to serve every region, channel or season with one set of assumptions, ends up averaging away exactly the signal that would have caught the spike. Regional weather patterns, local festive calendars, and channel-specific buying behavior all shift the demand curve differently and a forecast that treats them as one curve will systematically overstock the quiet pockets and understock the ones about to peak.
Lumpy, Bulk-Order Demand Patterns
Irregular ordering behavior is one of the fastest ways to break a time-series model. Some customers or channels place one large order, go quiet for several weeks, then order again in bulk a pattern that looks like noise to a model trained on smooth, evenly-distributed demand. Without a way to sense and adjust to that pattern in near real time, the forecast either overreacts to the spike or misses it entirely.
What “Good Enough” Forecasting Actually Looks Like
Move Past Historical Averages With Demand Sensing
Rather than relying solely on last year's numbers, demand sensing layers in near-term signals recent order patterns, calendar effects, weather, promotions and channel telemetry to sharpen the forecast as the season approaches, not after it has already passed.
Forecast at the Right Granularity SKU x Location, Not Category
A category-level or national forecast will always smooth over the exact variation that causes seasonal misses. Forecasting at SKU-and-location level, with confidence bands rather than a single number, gives planners the resolution to catch a regional or product-specific spike before it becomes a stockout.
Track Accuracy Continuously, Not Just at Quarter-End
A forecast accuracy management layer that compares predicted versus actual on an ongoing basis flagging over- and under-prediction as it happens lets the model correct itself month over month, instead of discovering the miss three months later in a review meeting.
Model the Season Before It Arrives, With Scenario Simulation
Scenario planning lets teams layer known demand drivers a promotion, a price change, a seasonal event onto the statistical baseline, compare outcomes quantitatively, and commit to a plan before the peak hits, rather than reacting once it's underway.
What Better Forecasting Actually Delivers
These aren't theoretical gains. Two examples from Enmovil's Forecasting platform show what closing the accuracy gap looks like in practice.
A Fast-Growing D2C Health & Wellness Brand
Static safety stock levels, reviewed infrequently, couldn't keep pace with the brand's growth across D2C, quick-commerce and modern trade. Replacing static parameters with continuously updated, demand-driven logic and connecting finished-goods demand signals upstream to raw material planning changed the outcome materially:
Metric | Result | Context |
|---|---|---|
Stockout Reduction | 60-70% | Previously frequent, unpredictable stockouts across channels |
Inventory Holding Cost | 25-30% cut | Capital unlocked from excess safety stock |
Planner Bandwidth Freed | ~50% | Reallocated from routine reorder tasks to exceptions and strategy |
OTIF at SKU Level | 95%+ | Enabled by demand-driven, continuously updated planning |
A Global Precision Manufacturer
Multiple parallel spreadsheet forecasts and lengthy manual consensus cycles meant slow-moving SKUs accumulated excess inventory while fast-moving lines stocked out two symptoms of the same broken forecasting process. A structured scenario planning layer, built on top of a statistical baseline, let planners create named scenarios, compare them quantitatively against the baseline, and push a validated plan to S&OP consensus with a full audit trail replacing weeks of spreadsheet reconciliation with a single structured review.
How to Move From 75% to 90%+ Forecast Accuracy
1. Audit your current forecast granularity if you're forecasting at category or national level, that's usually the single biggest source of hidden error.
2. Layer in demand sensing signals recent orders, calendar effects, weather and promotions instead of relying solely on historical averages.
3. Build scenario models for known seasonal drivers before the season starts, not after the first miss.
4. Track forecast-vs-actual continuously, with bias and accuracy visible every cycle — not just at quarterly review.
5. Connect the demand signal directly to inventory and replenishment logic, so a better forecast actually changes what gets ordered, and when.
Enmovil's Forecasting platform brings demand sensing, SKU-level accuracy tracking and scenario simulation into one connected layer. If your team is still treating 75% as the finish line, we'd welcome the conversation.
Frequently Asked Questions
What is a good forecast accuracy percentage for seasonal businesses?
Why does forecast accuracy drop during seasonal peaks?
What's the difference between demand forecasting and demand sensing?
Share this article