Fleet Sizing & Fleet Mix Optimization Software India
Fleet sized. Capacity planned. Before dispatch begins.
Enmovil's AI-native fleet management software for India analyses lane-wise shipment demand, VAHAN-verified vehicle data, AIS 140 GPS utilisation records, and FASTag movement history via ULIP — producing a structured capacity plan that determines your dedicated, contract, and spot fleet mix across every plant, warehouse, depot, and dealer network node, before dispatch planning begins.
See CADDIE answer itWhy manual fleet sizing fails at scale
Fleet sizing run on last year's data means over-contracted lanes and under-resourced ones — found only after dispatch is already in motion.
Fleet decisions made on instinct
Vehicle count and carrier mix set from last year's pattern, not current demand — lane imbalances surface only after dispatch is already running late.
Spot procurement as the default
Without a structured capacity plan, spot fills gaps contracted fleet could cover — at a 30–50% rate premium on North-Central, West Coast, and East Zone corridors.
Route consolidation missed at scale
Multi-yard to multi-dealer legs and geo-aligned drop clustering stay invisible without full-network visibility.
No visibility before the plan breaks
Capacity shortfalls surface during dispatch, when fleet restructuring is no longer possible. Axle load penalties, permit lapses, and BS6 gaps stack costs a demand-driven plan would have caught upfront.
Fleet optimization must run on real demand signals — and produce one plan dispatch, procurement, and leadership all act from.
How Enmovil fleet sizing works — Analyse. Determine. Plan.
From historical shipment data to a network capacity plan — fleet sized, carriers allocated, spot structured, before dispatch begins.
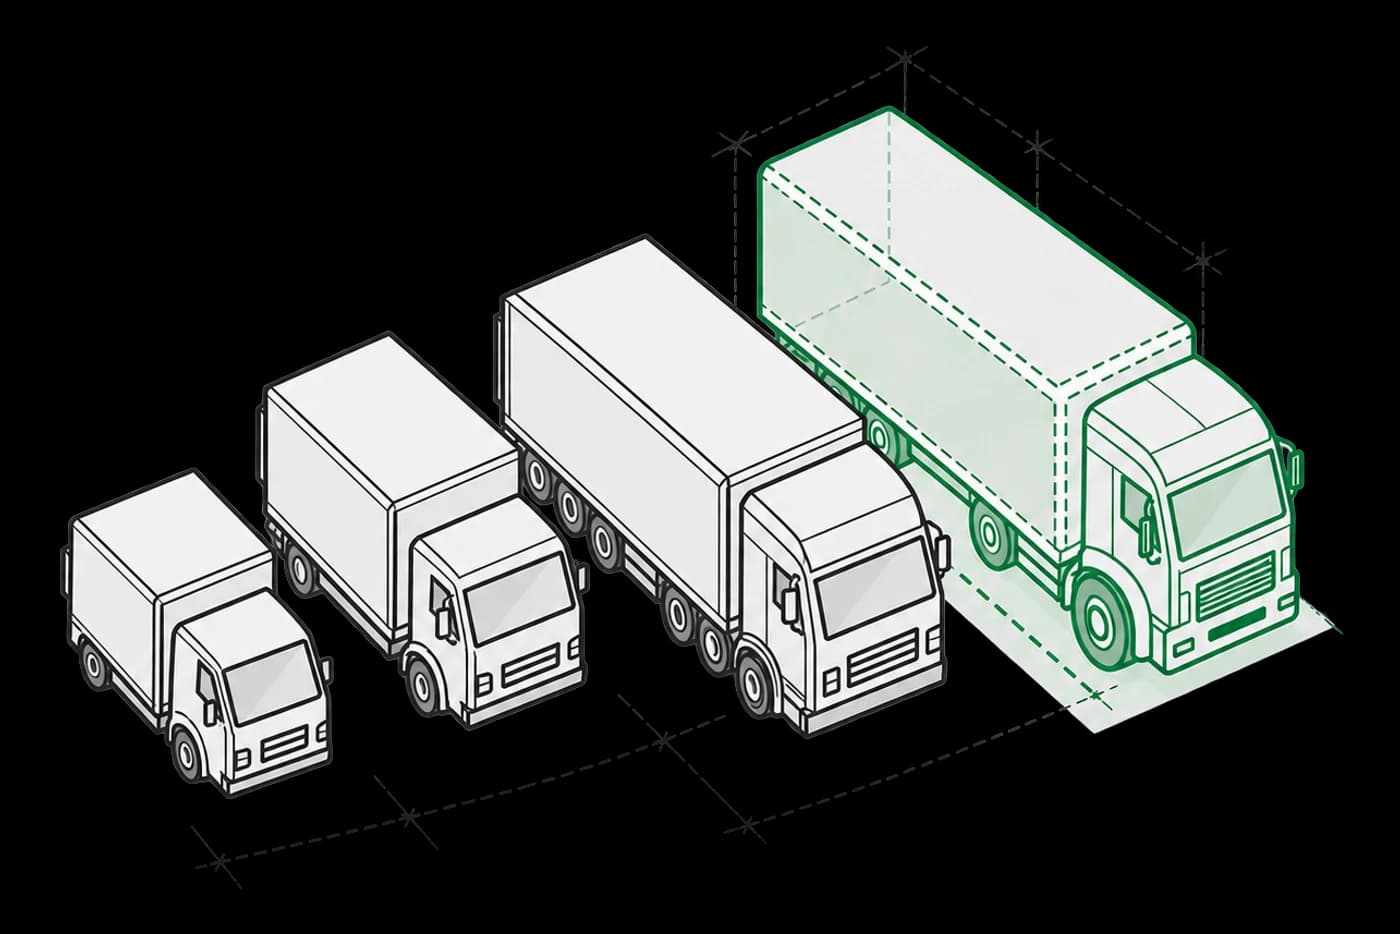
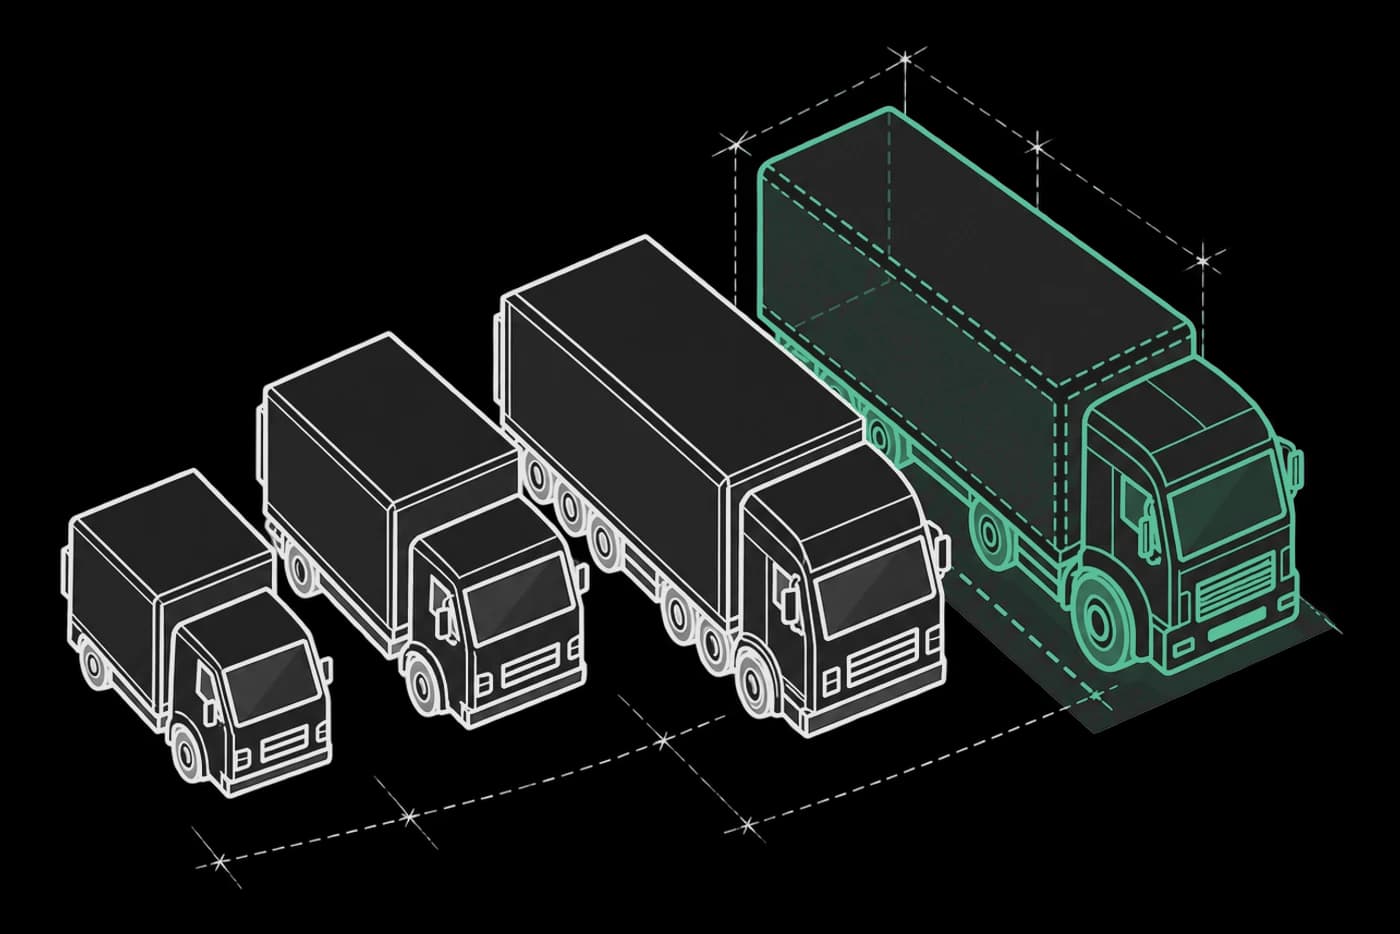
- 01
Analyse
Historical shipment volumes, AIS 140 GPS utilisation, FASTag transit times via ULIP, and consolidation opportunities per lane and node. VAHAN records feed fleet condition and permit/fitness timelines.
- 02
Determine
Capacity requirements, vehicle mix against BS6 and axle load norms, and carrier contracting needs per O-D pair. Overloading risk flagged before confirmation.
- 03
Plan
A structured capacity plan by tier — dedicated, contract, spot — per lane. Executable baseline before dispatch planning begins.
Technical details · capabilities and constraints
- Network & Route Optimisation
- Best route plan across a multi-node network — shipments consolidated, routes sequenced, mode and carrier matched per lane, including multi-yard to multi-dealer routes with interim stops.
- So you canConsolidate into fewer, fuller trips planned against your network's real structure.
- Multi-Point Load Clubbing
- Combines pickups across nodes into higher-utilisation trips using geo- and SLA-aligned drop-point clustering for dealer networks, CFA clusters, and urban distribution.
- So you canMove more per trip — fewer vehicles, fewer empty miles, no axle load breach.
- Fleet Decisioning & Carrier Allocation
- Shipment demand allocated Dedicated → Contract → Spot in priority order, with a spot tender workflow for carrier bidding when spot is required.
- So you canUse contracted fleet first, spot only when structurally necessary — auditable tender workflow per lane.
- Vehicle Mix Selection
- Right trailer or vehicle type per shipment on capacity, route constraints, axle load norms, and load characteristics. BS6 compliance per unit; spot-rate comparison picks the best FTL when contract capacity is exhausted.
- So you canMatch the right vehicle to the right load on every lane.
- Fleet Capacity Waterfall
- Demand allocated in priority — dedicated first, contract next, spot last — each tier checked against availability, permit/fitness status, and lane suitability before escalation.
- So you canStop running idle contracted vehicles alongside expensive spot hires.
Fleet capacity planning — Constraints configured once, applied automatically
Network Inputs
- Plants & manufacturing units
- Warehouses & distribution centres
- Regional depots
- Dealer & retail networks
Demand Data Sources
- Historical shipment demand by lane
- Lane-wise movement data and frequency
- Vehicle utilisation records (AIS 140 GPS)
- Route distance, cost structures, and ERP/TMS integration
India Compliance
- AIS 140 GPS mandate tracking per vehicle
- FASTag transit time data via ULIP integration
- Axle load norms and overloading penalty avoidance
- BS6 vehicle compliance flag
- Permit and fitness renewal status per fleet unit
- VAHAN database cross-reference
Optimisation Controls
- Dedicated → Contract → Spot waterfall sequence
- Multi-point load clubbing and geo-clustering
- Lane-wise VFR floor enforcement
- Spot tender automation and rate comparison
Ask your fleet planning platform anything — Caddie AI
Caddie reads live fleet and capacity data — lane requirements, allocation status, spot history, FASTag transit times, network gaps — and answers in plain language. No spreadsheets, no carrier calls, no manual gap analysis.
From Fleet Gap to Carrier Strategy — One Conversation
Caddie turns fleet and demand data into capacity decisions — before gaps become dispatch problems or unplanned spot costs.
SEE CADDIE + FLEET SIZING TOGETHER — Ask Caddie about your own network gaps in a live demo →
What demand-driven fleet capacity planning delivers for logistics operations
Live
Demand-driven fleet sizing from real lane data — not last season's numbers
3-Tier
Dedicated → Contract → Spot waterfall applied every capacity run
↓
Spot Cost
Contracted capacity maximised before spot is ever triggered
Full
Network
Plant to dealer — every node, every lane, every carrier tier covered
0
Last-Minute Spot Calls
Carrier strategy structured upfront, not improvised at dispatch
Ranges seen across Enmovil deployments · your KPIs are set against your own baseline
Case studiesSee the results in production, by industryManual reality
BEFORE — Manual Fleet Sizing:
- Fleet sized from last year's lane volumes and planner experience.
- Spot carriers used as default overflow on every corridor.
- Lane imbalances discovered only when dispatch is under pressure.
- No consolidation analysis across multi-node networks.
- Overloading penalties and permit lapses absorbed as operational cost.
With Enmovil
AFTER — With Enmovil Fleet Management Software:
- Demand analysed by lane using historical shipment data and AIS 140 GPS utilisation records.
- Fleet mix calculated — dedicated, contract, and spot tiers sized per lane.
- Dedicated → Contract → Spot waterfall applied, maximising contracted capacity first.
- Consolidation opportunities surfaced automatically across the full network.
- Axle load compliance, BS6 status, and permit/fitness renewal tracked per vehicle before the plan is confirmed.
The Operational Shift, Across Every Role
FOR LOGISTICS PLANNERS
Dispatch starts from a demand-validated fleet baseline with the waterfall applied — spot triggered only where structurally necessary.
FOR PROCUREMENT & CONTRACTS TEAMS
Carrier contracting requirements set by lane and volume before the contracting cycle opens. Spot tender workflow replaces ad-hoc calls with an auditable, lane-cost-backed process.
FOR SUPPLY CHAIN LEADERSHIP & FINANCE
Network capacity plan with cost modelling across all three tiers. FASTag via ULIP gives verified transit benchmarks; axle load and BS6 tracking cut penalty exposure and support ESG reporting.
FOR CARRIER PARTNERS
Lane volumes and frequency shared in advance through structured tendering — rate transparency and selection logic feed back into the next cycle.
Trusted by industry leaders


Industries served
See all industries →
Motoryzacja
Dispatch Planning

FMCG
Forecasting

Budownictwo
Dispatch Planning

Przemysł
Tracking & Visibility

Farmacja
Tracking & Visibility

Ropa, gaz i energia
Dispatch Planning

Elektrotechnika
Tracking & Visibility

Telekomunikacja
Dispatch Planning
What buyers ask us first.
Asked in discovery calls, answered plainly.
Enmovil's AI-native fleet management software for India analyses lane-wise shipment demand, VAHAN-verified vehicle data, AIS 140 GPS utilisation records, and FASTag movement history via ULIP — producing a structured capacity plan that determines your dedicated, contract, and spot fleet mix across every plant, warehouse, depot, and dealer network node, before dispatch planning begins.
Adjacent supply chain modules
New to the topic? Read the guide: What is dispatch planning and route optimization?
Postaw CADDIE nad tym, czego już używasz.
Niczego nie wymieniasz. Zostaw służbowy e-mail, a pokażemy Ci CADDIE na Twojej własnej operacji – w 15 minut.